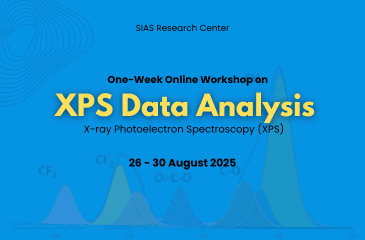
Online Workshop on XPS Data Analysis
Training Program on XPS X-ray Photoelectron Spectroscopy XPS Spectra Analysis Menu All Events Upcoming Events Past Events Testimonials Request For Collaboration One-Week Online Workshop on XPS Data Analysis X-ray Photoelectron Spectroscopy (XPS) Register Now Date 26 – 30 August 2025 Time 07.30 pm IST About the Workshop The 5-Day Online Workshop on XPS Data Analysis offers a comprehensive introduction and hands-on experience in X-ray Photoelectron Spectroscopy (XPS) data analysis, one of the most powerful surface characterization techniques in materials science. This workshop is designed for researchers, students, and professionals looking to strengthen their understanding of XPS principles, instrumentation, and data interpretation. Participants will gain insights into the physics behind photoemission, the working components of an XPS instrument, and methods for elemental and chemical state analysis. Each session is carefully structured to combine theoretical background with practical approaches, including live demonstrations of real data analysis. A dedicated session is reserved for participants to analyze their own datasets or provided examples under expert guidance. Target Audience Students, Researchers and faculty members of chemistry, physics and material science Key Topics: XPS Spectra Analysis: Elemental Identification & Quantification Applications of XPS in Modern Research: Live Data analysis using XPS in nanomaterials, catalysts, semiconductors, and thin films Features Real-time XPS data analysis using case studies from nanomaterials, catalysts, semiconductors, and thin films. Dedicated session for participants to analyze their own data or sample datasets with guided support. Recording for Future Referenece All live sessions will be recorded and made available to participants for future reference and continued learning. Course Completion Certificate At the end of the workshop, participants will receive an e-certificate of completion. Course Plan Please download the course plan and Brochure from the links provided below. Download Schedule Download Poster Schedule One-Weeek Workshop on XPS Data Analysis Day & Time Session Topics Link Day 1, 07.30 pm Introduction: Background Theory Photoelectric effect (Einstein’s concept) Principle of XPS and instrumentation overview Types of electrons detected (core-level, Auger) Day 2, 07.30 pm “Inside an XPS Instrument: Components, Working & Calibration” X-ray sources: Al Kα and Mg Kα Electron energy analyzers (hemispherical analyzer) Vacuum system, detectors, and data acquisition Energy resolution and instrument calibration Types of samples suitable for XPS Day 3, 07.30 pm XPS Spectra Analysis Understanding peak positions, intensities, and widths Peak fitting and deconvolution techniques Chemical shift and oxidation state information Quantitative analysis: atomic concentration calculations Survey scans vs. high-resolution scans Day 4, 07.30 pm Applications of XPS in Modern Research Live Data analysis using XPS in nanomaterials, catalysts, semiconductors, and thin films Day 5, 07.30 pm Doubt-Clearing Session Participants data analysis using XPS in nanomaterials, catalysts, semiconductors, and thin films Resource Person Github Linkedin Facebook Google-plus Dr. Dhanabal R Deptment of Physics, National Institute of Technology Pondicherry Github Linkedin Facebook Google-plus Github Linkedin Facebook Google-plus Registration Registration Fee Rs. 2000 Register Now Registration Fee For Indian Participants: Rs. 2000Foriegn Participants: USD. 45 SIAS Research Forum MembersStudent Member: Rs. 1800Faculty Member: Rs. 1600 Feedback from the participants We will update this part after the compltion of the workshop!


